Data & Technology
Built experience across software, web, reporting, dashboards, and data-related projects.
Hi, I’m Amzad Hossain, a Data Analyst with 10+ years of experience working with data, dashboards, reporting, and technology. I use SQL, Power BI, Excel, Python, and R to turn complex data into practical business insights.

Data analysis, statistics, reporting, and business intelligence with a practical approach.
My background combines data analytics, software and web technology, reporting, and graduate-level statistics. I enjoy cleaning and understanding data, building useful dashboards, and communicating results in a way that business and technical teams can use.
I recently completed my M.S. in Statistics & Analytics at the University of Arkansas. My graduate thesis focused on evaluating mental health sentiment scales using Item Response Theory, including exploratory and confirmatory factor analysis, graded response modeling, and differential item functioning analysis.

Querying, joining, validating, and transforming data for analysis and reporting.
Interactive dashboards, business reporting, KPIs, and data visualization.
Advanced analysis, reporting, formulas, automation, and VBA.
Statistical analysis, data preparation, modeling, and reproducible workflows.
Built experience across software, web, reporting, dashboards, and data-related projects.
Worked with e-GP procurement data and reporting while continuing hands-on analytics work.
Graduate study at the University of Arkansas with advanced statistical and analytics training.
Focused on Data Analyst, BI Analyst, and Business Systems opportunities in the U.S.
“Good analysis makes complex data easier to understand, act on, and trust.”
A practical analytics toolkit for data preparation, analysis, visualization, and reporting.
SQL, Oracle, data extraction, cleaning, transformation, validation, relational data, and reporting workflows.
Power BI dashboards, KPI reporting, visual storytelling, data exploration, and stakeholder-focused reporting.
Statistical modeling, EFA, CFA, Item Response Theory, regression, measurement, and research analysis.
Data manipulation, statistical analysis, visualization, modeling, and reproducible research.
Advanced Excel analysis, formulas, data preparation, reporting, and workflow automation with VBA.
AWS/S3, DBeaver, Hue, Jupyter, Linux, Git, and modern data-development environments.
I combine technical data skills with statistical thinking: first understand the data, then build a reliable analysis, and finally communicate the result in a form that people can use.
Selected experience, education, and competencies.
More than nine years of data-related and technology experience across analytics, reporting, dashboards, and software projects.
Support data collection, cleaning, validation, dashboards, visualizations, SQL analysis, and reporting in a remote analytics role.
Worked with procurement-related data and analytics, contributing to data-driven reporting and analysis for e-GP projects.
Supported data pulling, dashboard maintenance, development, reporting, and technology projects for analytics-focused teams.
Graduate training in statistics and analytics combined with a technology-focused academic foundation.
Graduate study in statistics and analytics. Thesis: “Item Response Theory Evaluation of Mental Health Sentiment Scales.”
Academic foundation supporting a long-term career across information technology, data, and analytics.
Skills I bring to Data Analyst, BI Analyst, and analytics-focused business roles.
Selected analytics projects demonstrating statistics, visualization, reporting, and data problem-solving.
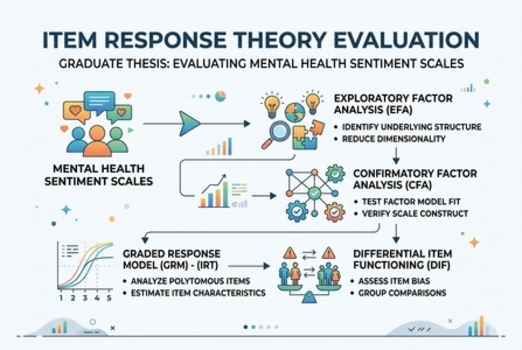
Graduate thesis evaluating mental health sentiment scales using EFA, CFA, GRM, and DIF analysis.
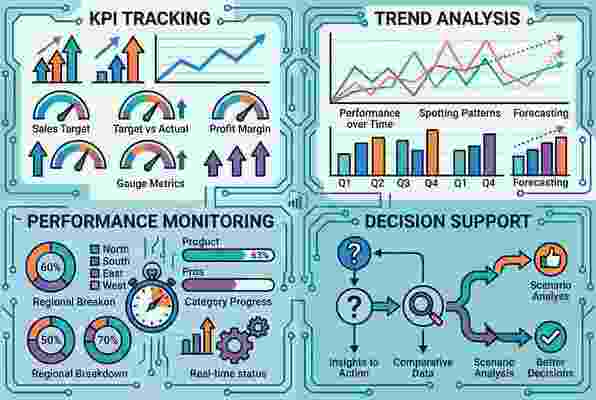
Business-focused dashboard concepts for KPIs, trends, performance monitoring, and decision support.
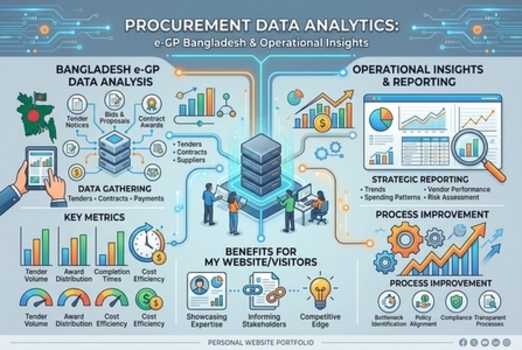
Data analysis and reporting related to e-GP procurement data and operational insights.
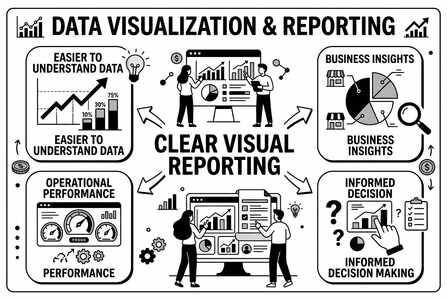
Clear visual reporting designed to make business and operational data easier to understand.
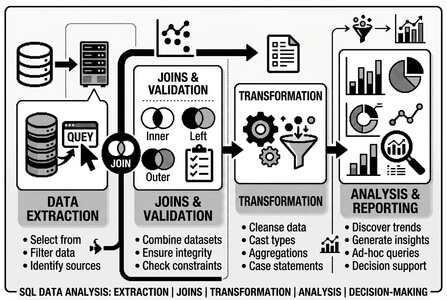
Data extraction, joins, validation, transformation, and analysis for reporting and decision-making.
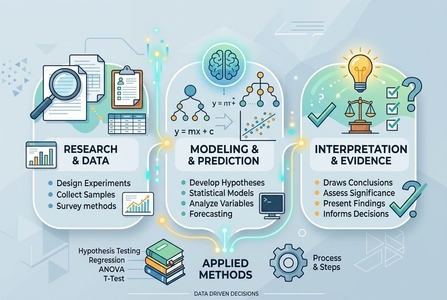
Applied statistical methods for research, measurement, modeling, and evidence-based interpretation.
Analytics services and capabilities I can bring to a team or project.
Clean, transform, explore, and analyze data to identify patterns, trends, and useful business insights.
Build clear dashboards and KPI reports that help teams monitor performance and make informed decisions.
Extract, join, validate, and prepare data from relational sources for analysis and reporting.
Apply statistical methods to research and business questions and communicate results clearly.
Create analysis-ready spreadsheets, reports, recurring workflows, and practical data summaries.
Translate technical analysis into concise findings, recommendations, and decision-ready communication.
A few quick answers about my background and work.
I am interested in Data Analyst, Business Intelligence Analyst, Business Systems Analyst, and related analytics roles where I can use SQL, Power BI, statistics, Excel, Python, and R.
I completed an M.S. in Statistics & Analytics at the University of Arkansas, with a thesis focused on Item Response Theory and mental health sentiment scales.
My main tools include SQL, Power BI, Excel/VBA, Python, R, Oracle, DBeaver, Hue, Jupyter, AWS/S3, and Linux.
Yes. My background across data, software, dashboards, and graduate statistics helps me communicate between technical details and practical business needs.
Yes. If you are hiring for an analytics or business intelligence role, I would be glad to connect and discuss how my experience could support your team.
Interested in working together or discussing an analytics opportunity?
Send me a message about a Data Analyst, BI, analytics, or data project opportunity.